Redesign that made OKR management 30% faster. Case Study
My contribution
• Discovery and research
• Collaboration with Stakeholders
• Interactive Prototypes
• Interface Design
• Guidelines for Development
Primary goals and objectives
Business goals:
• Increase customer retention rate
• Boost engagement through improved usability and features
• Drive revenue growth by delivering higher value to users
Design objectives:
• Redesign the plugin
• Introduce new OKR views
• Improve user onboarding to ensure seamless adoption of the plugin
• Introduce progress visualization features to enhance team alignment and productivity
• Optimize navigation
Platform
• Web
✅ Results
Business Results:
• +30% new companies in 2023 due to plugin redesign and new features
• Retention grew from 70% to 85% due to simpler OKR management and improved progress visualization.
• Revenue increased by 38% in one year
Design Results:
• Weekly active users (WAU) increased by 20%, with 80% of users regularly updating their OKRs
• Retention increased from 65% to 87% over six months post-redesign, showing that the improved experience retained more users
• Navigation Error Rate Dropped from 10% to 3%, indicating that users are less likely to misclick or get lost
• OKR completion rates increased from 65% to 78%
• Redesigned table and filter functionality reduced the time required to create and update OKRs by 30%
• Positive feedback highlighted the redesign's impact on usability and overall experience.
Improving OKR Creation
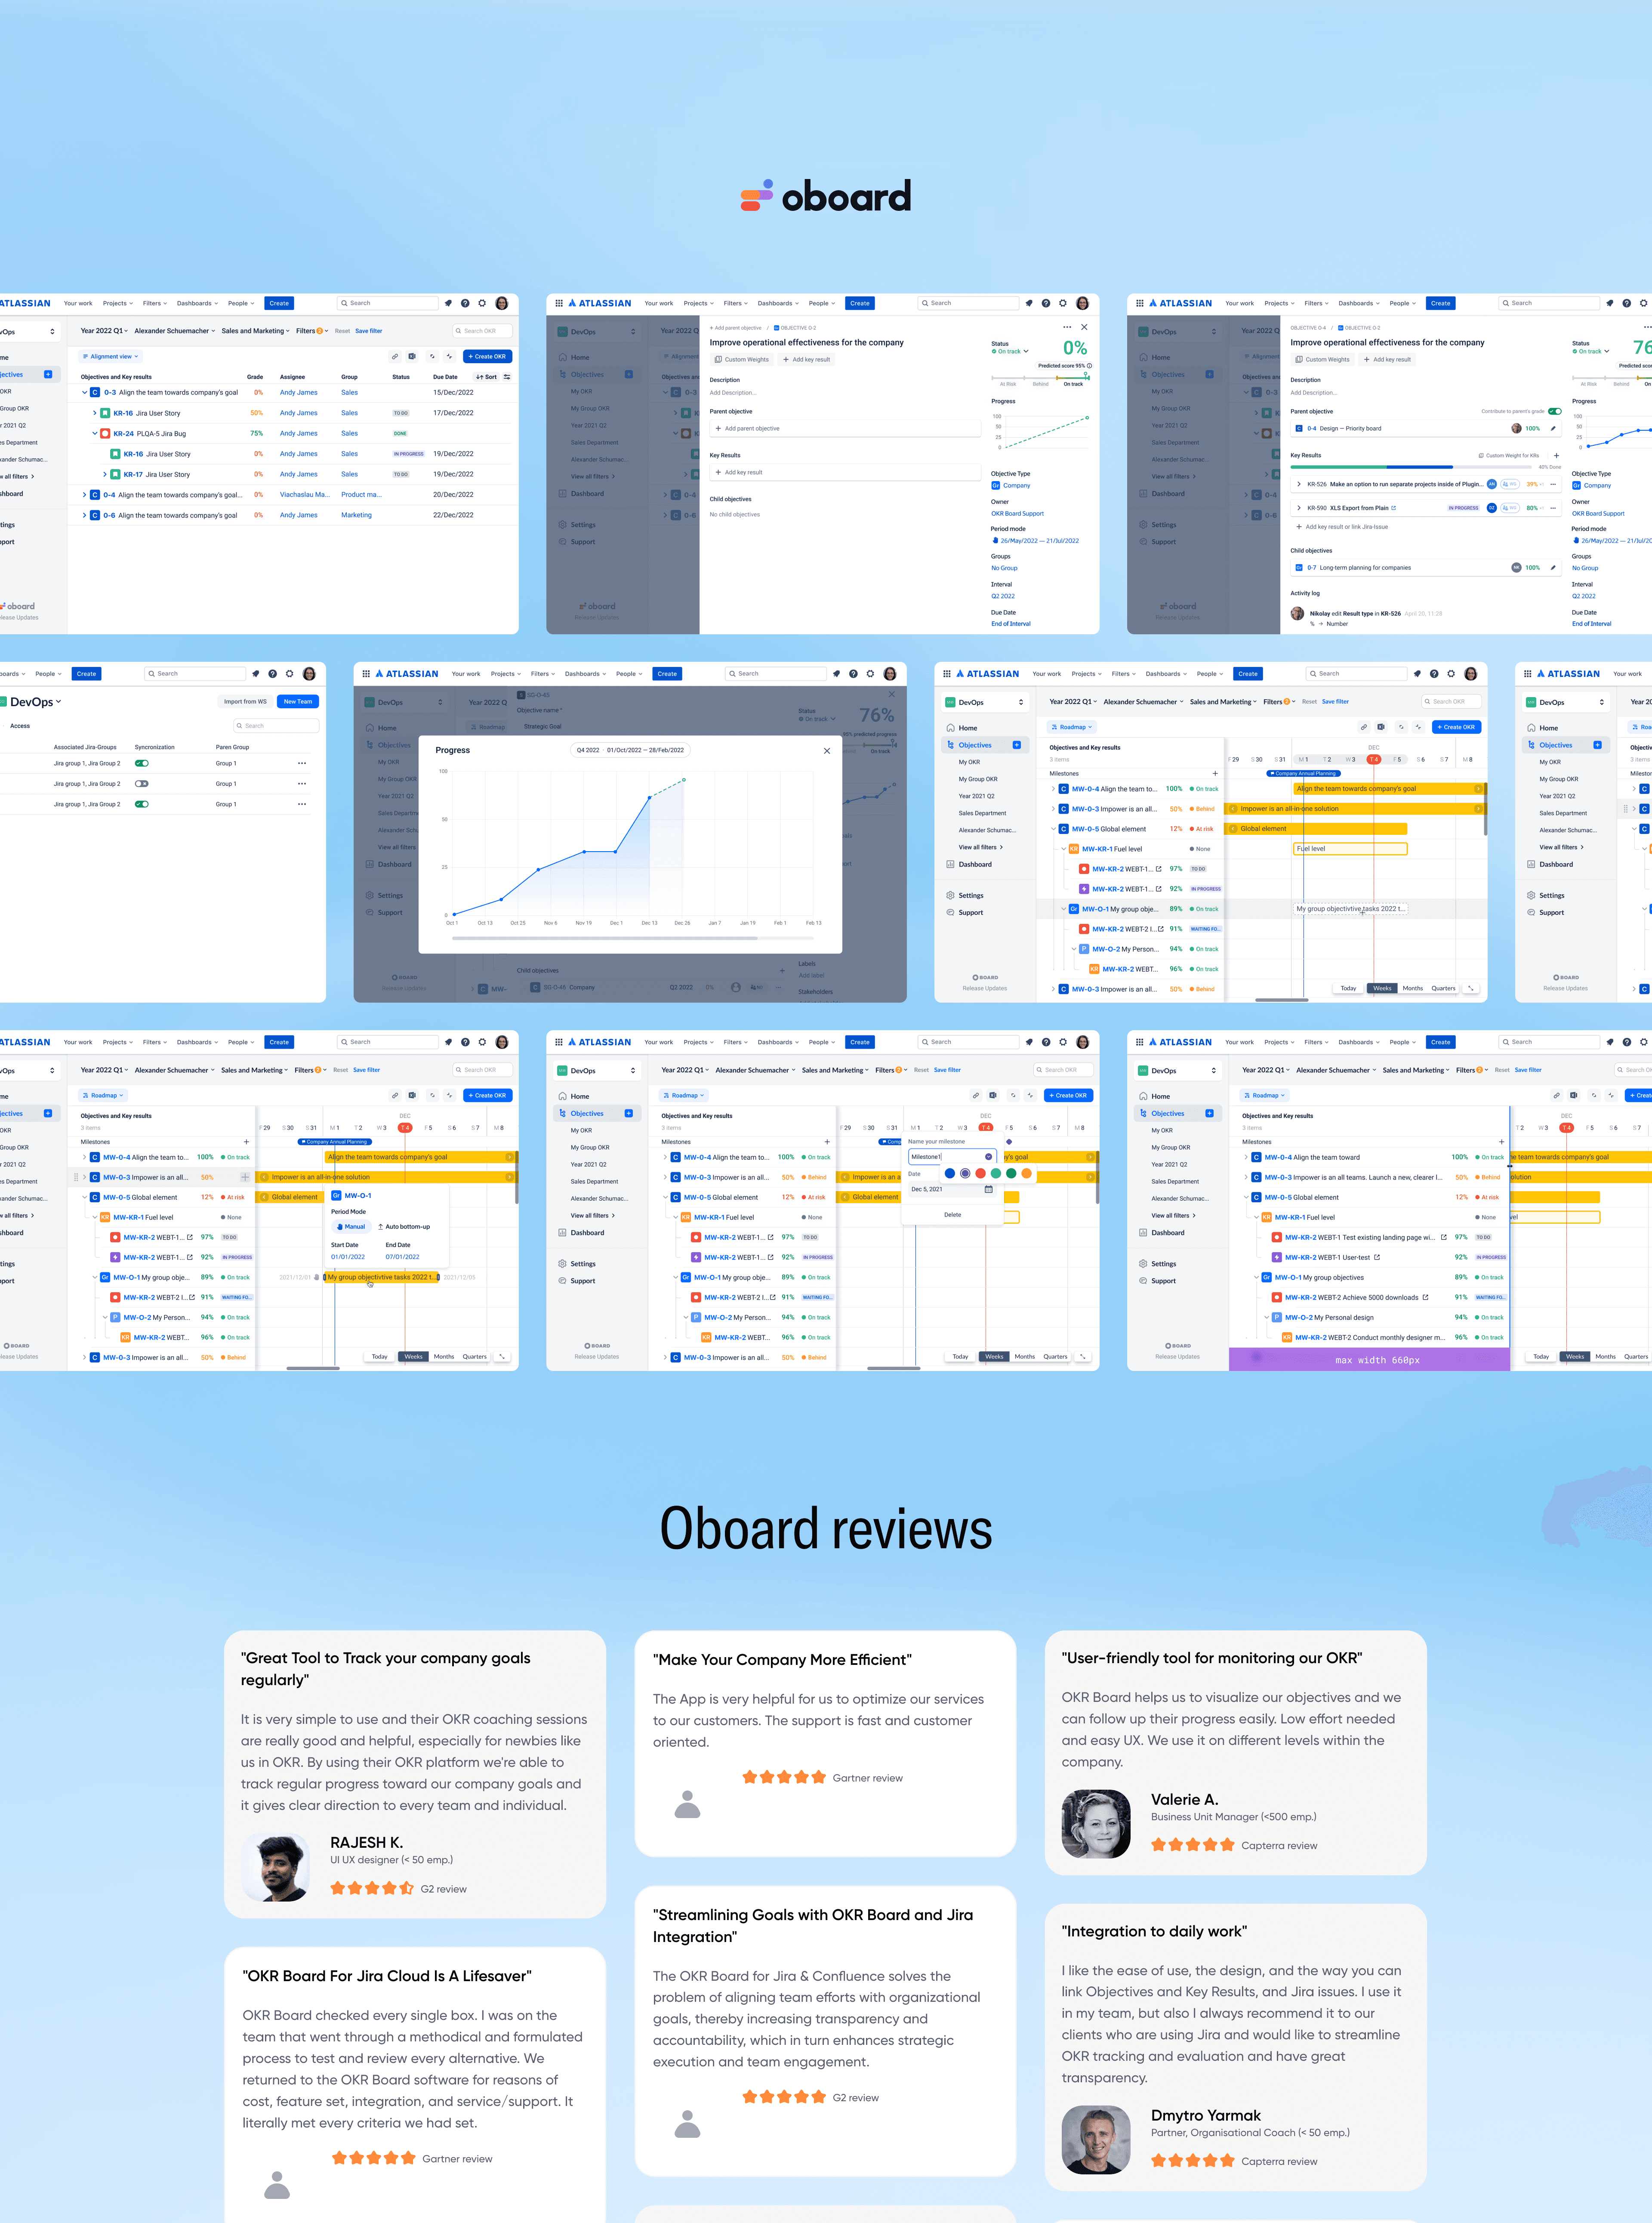
The OKR creation process was completely redesigned, incorporating a wide range of new features to simplify future interactions with OKR cards. Key patterns were adopted from Jira, making the process more intuitive for new users.
Side menu and filters
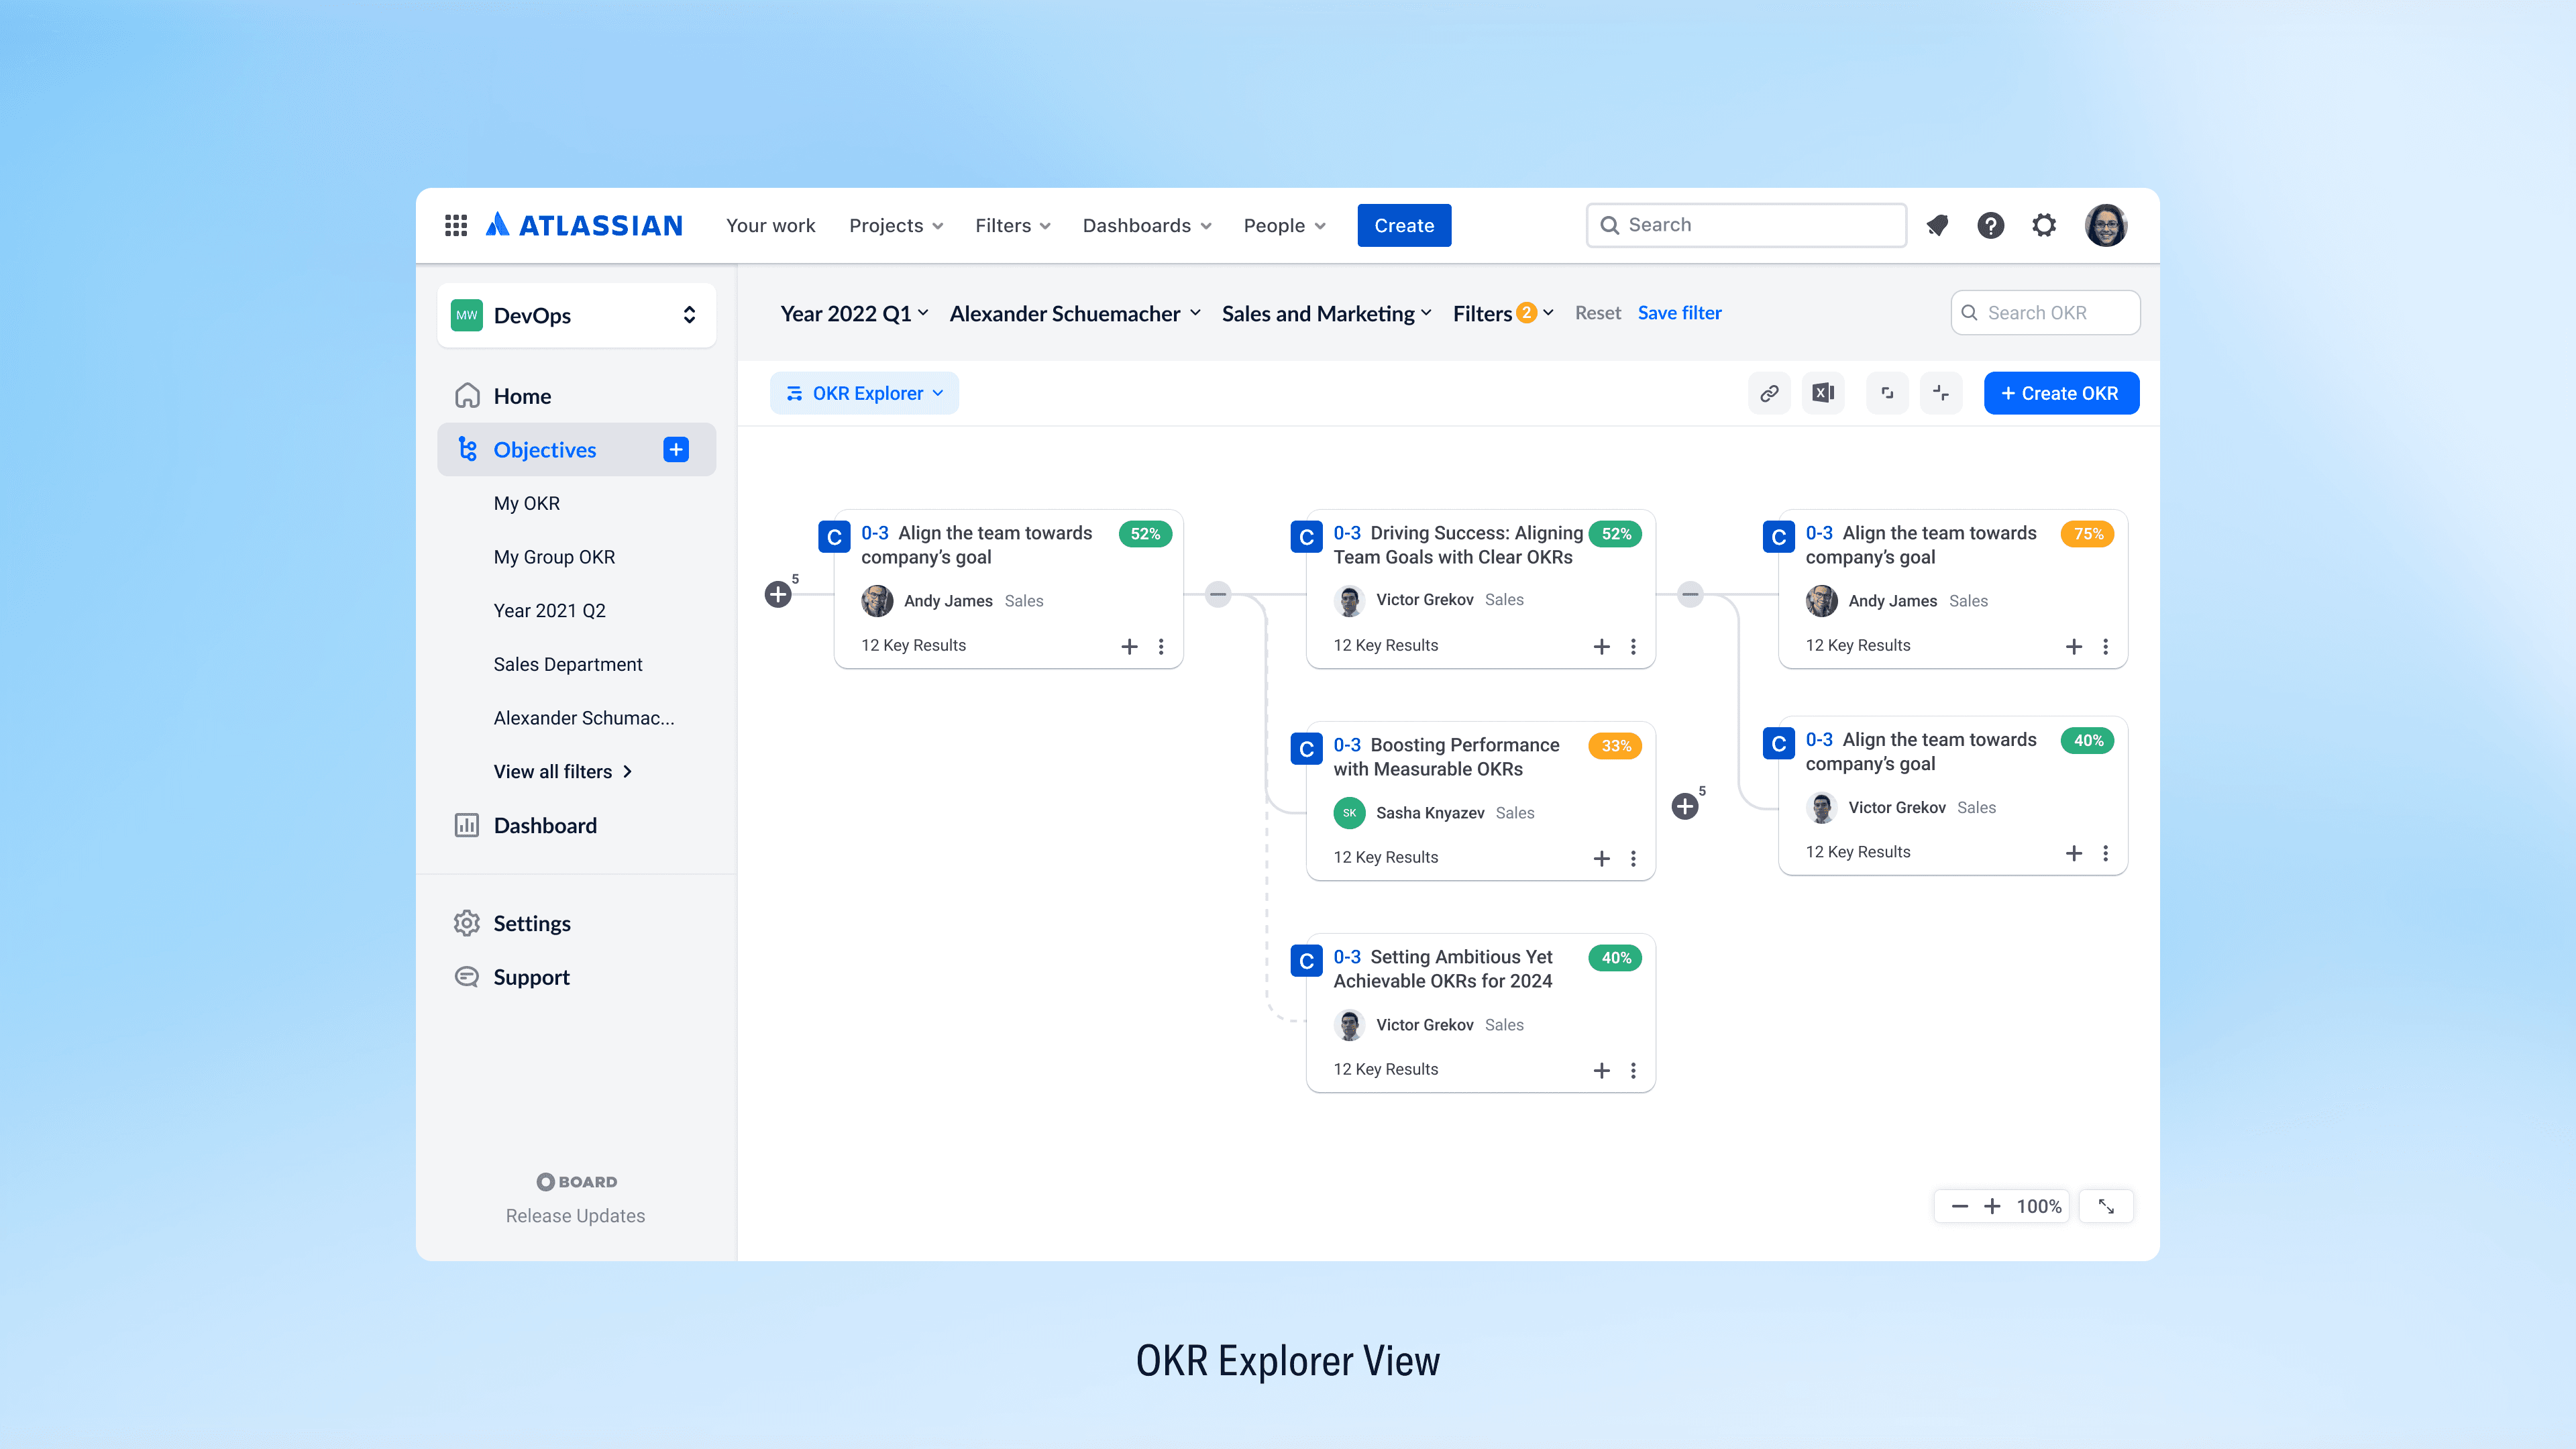
The side menu has been completely redesigned, now allowing users to save quick filters and switch between them effortlessly. The redesigned filter functionality reduces the time required to create and update OKRs.
Roadmap View
Oboard’s roadmap view allows teams to visually track the progress of projects by displaying tasks and milestones along a timeline. It provides a clear overview of the project’s trajectory, making it easier to manage dependencies and ensure timely delivery.
Adding milestones
Milestones represent key points or goals in the timeline of a project. These milestones are used to track significant achievements or deadlines that help organize and measure progress.

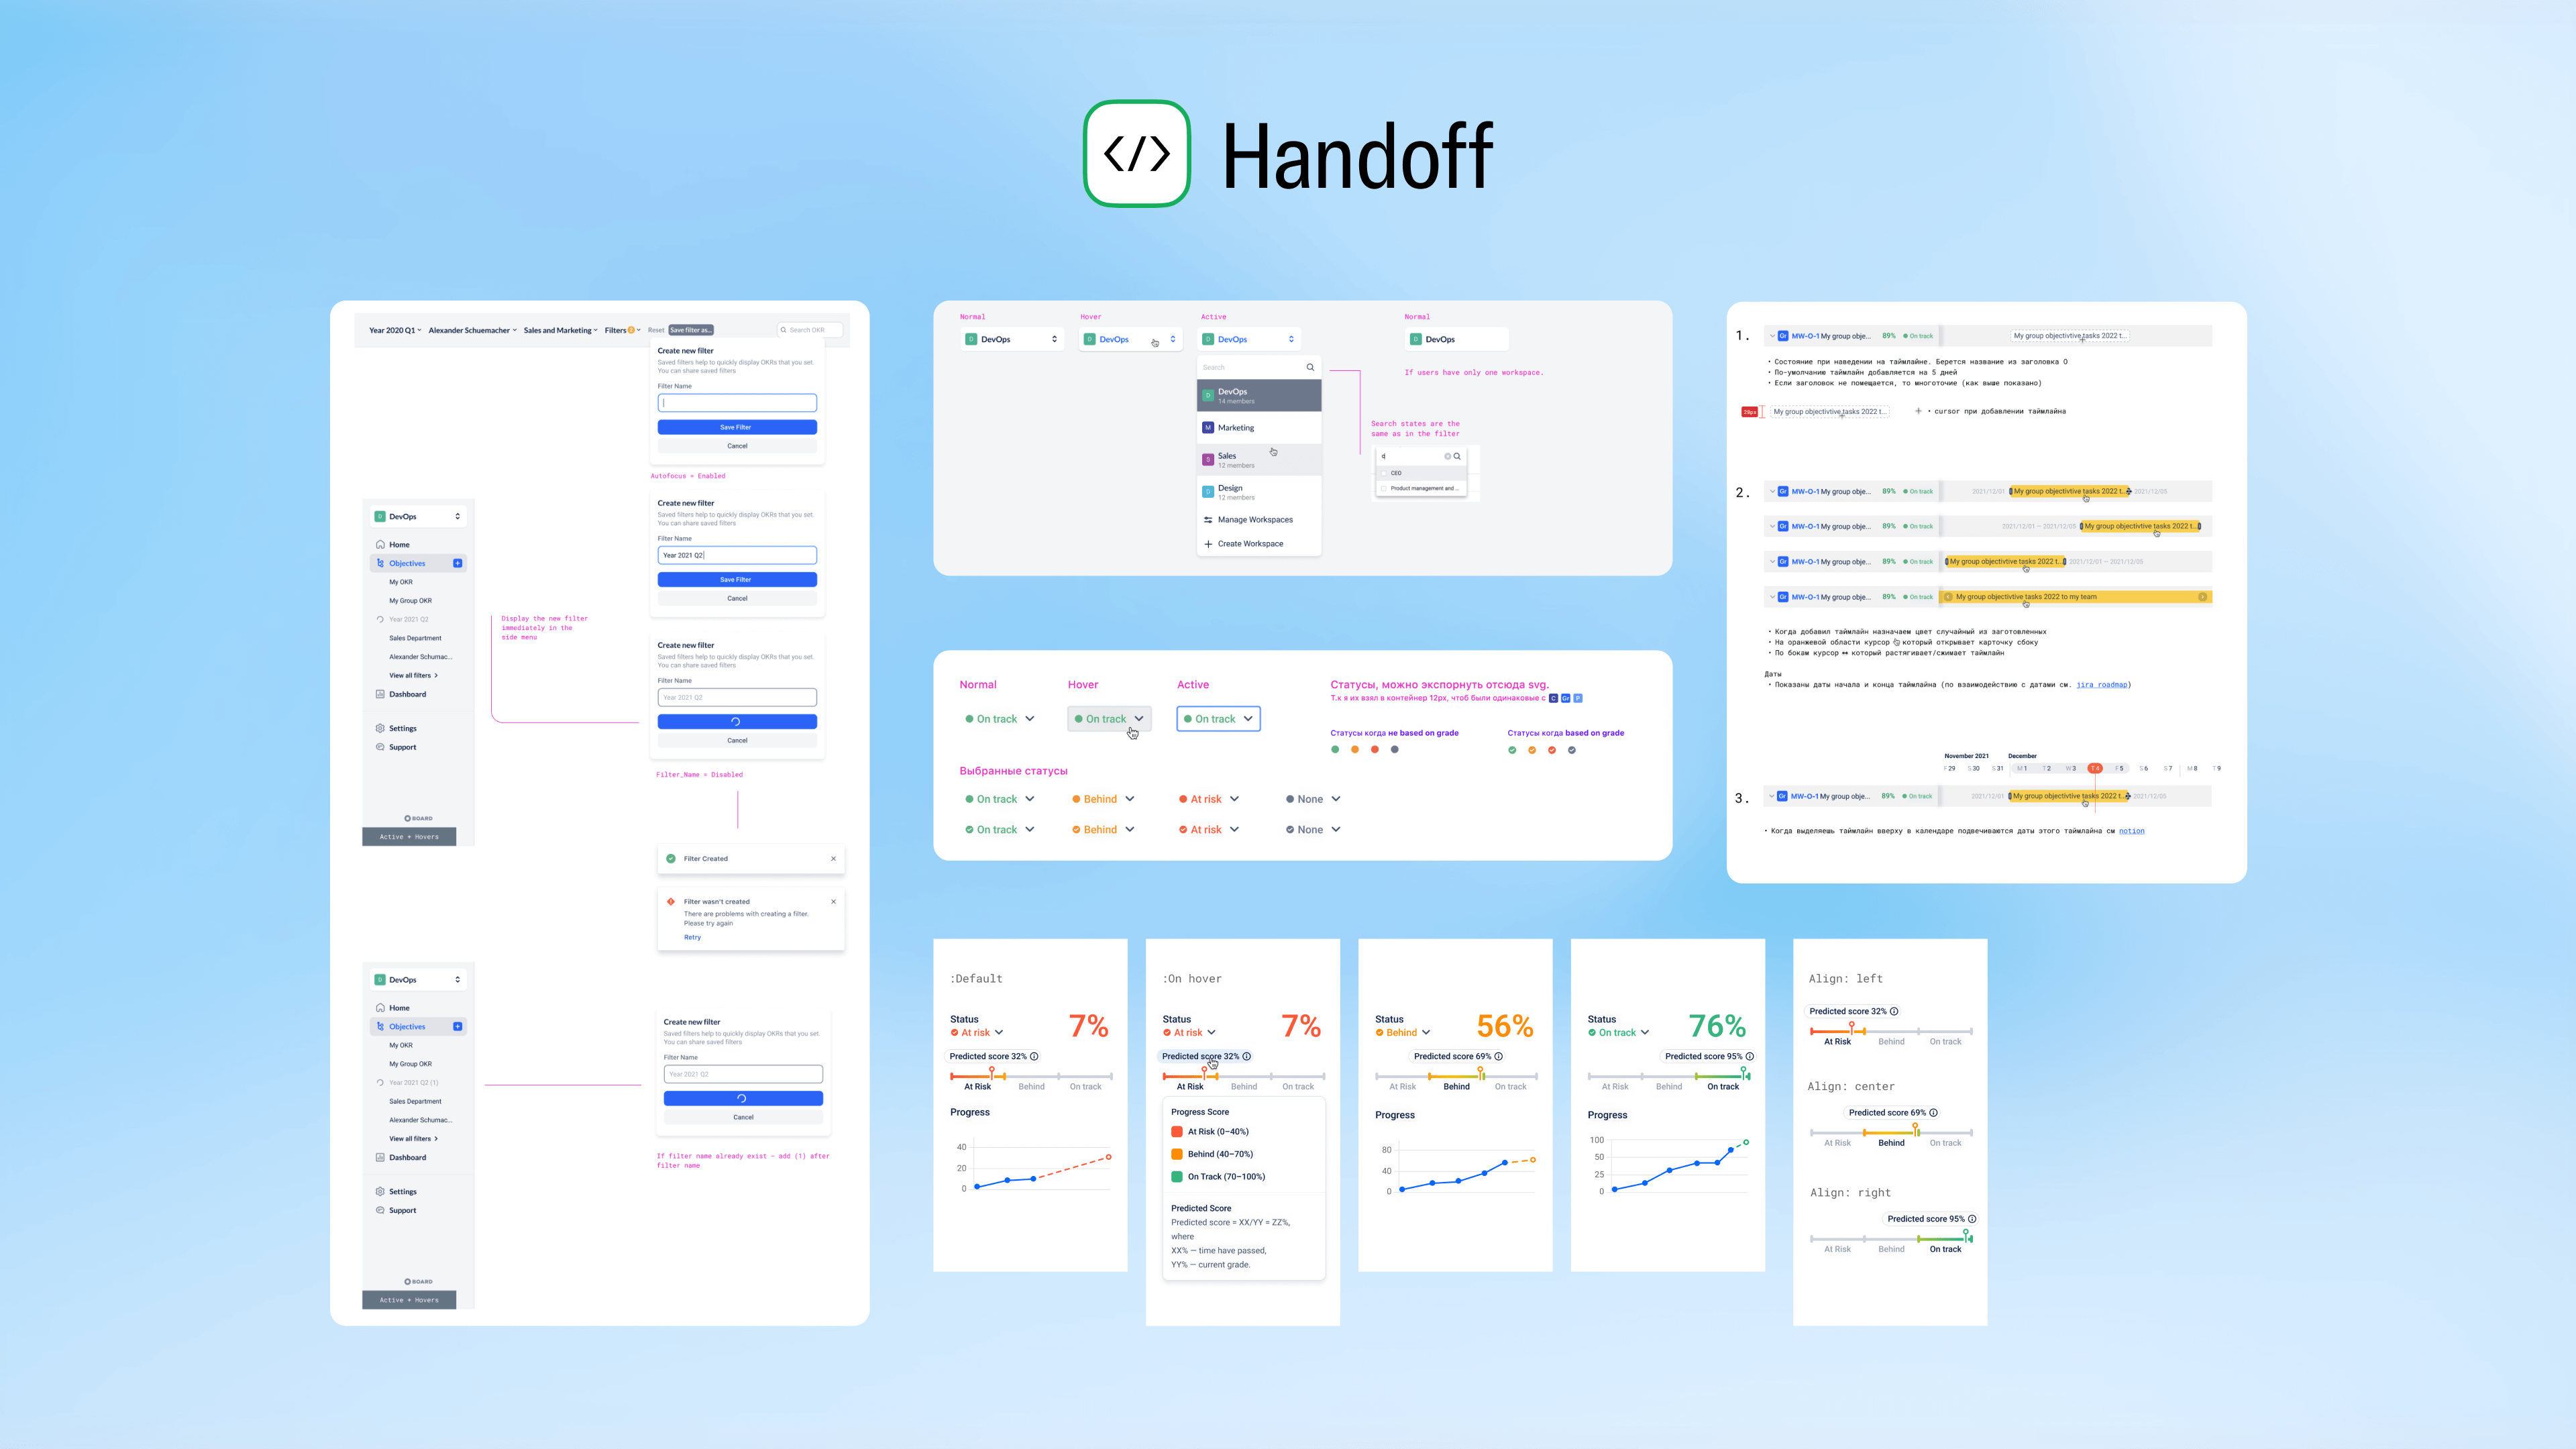
Handoff
Mockups with clear descriptions were given to development. The developers provided positive feedback on the quality of the specifications and the clarity of the mockups.


✅ Results
Business Results:
• +30% new companies in 2023 due to plugin redesign and new features
• Retention grew from 70% to 85% due to simpler OKR management and improved progress visualization.
• Revenue increased by 38% in one year
Design Results:
• Weekly active users (WAU) increased by 20%, with 80% of users regularly updating their OKRs
• Retention increased from 65% to 87% over six months post-redesign, showing that the improved experience retained more users
• Navigation Error Rate Dropped from 10% to 3%, indicating that users are less likely to misclick or get lost
• OKR completion rates increased from 65% to 78%
• Redesigned table and filter functionality reduced the time required to create and update OKRs by 30%
• Positive feedback highlighted the redesign's impact on usability and overall experience.
